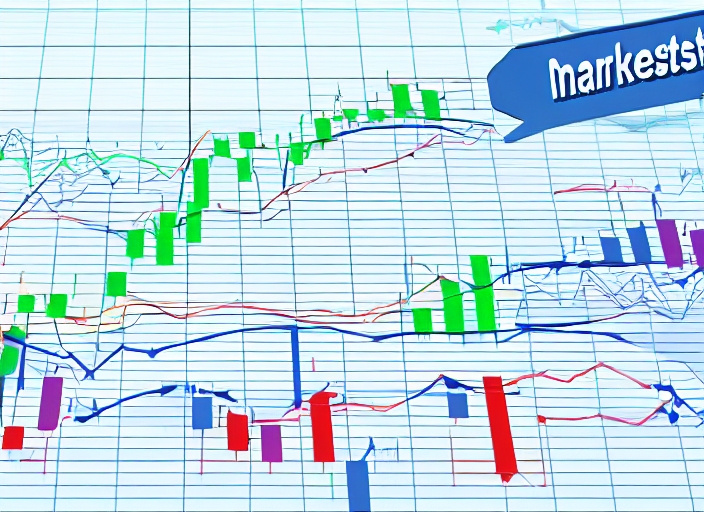
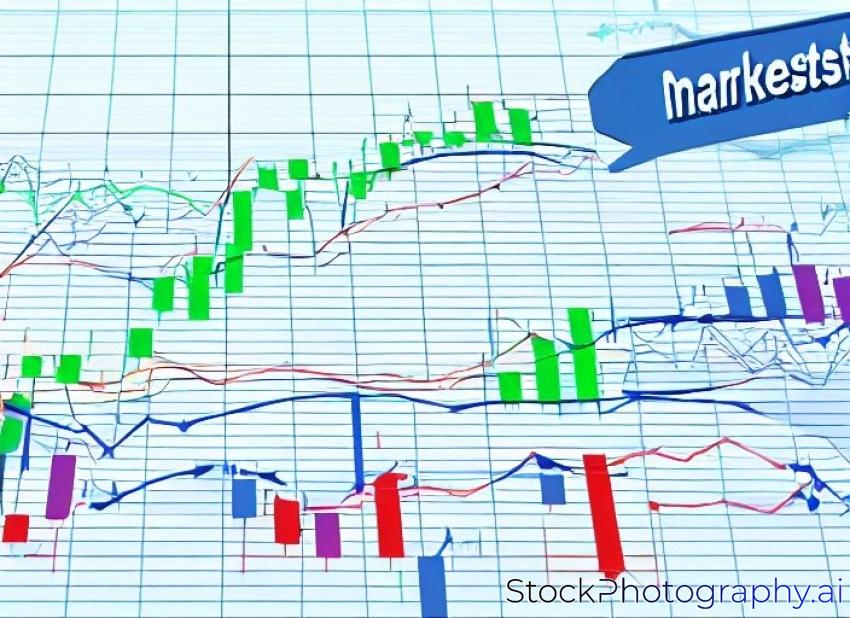
market trading graph and candlestick chart for business concept about financial investment.


-
22
-
0
License and Use
Free for commercial use No attribution required
- Created With Redmond.ai
- Details
- Published on Nov 09, 2022
- Photo type JPG
- Category Business/Finance